
Dashboard#
openYuanrong 提供了可视化的 dashboard,用于查看集群和函数实例的状态等信息,便于监控和快速排查问题。目前 dashboard 支持上千条实例数据的稳定承载与展示。
启动 Dashboard#
要访问 dashboard,需要在部署 openYuanrong 集群主节点时,加上 --enable_dashboard=true 参数以及依赖项参数。使用 dashboard 全量功能,主节点的部署命令如下:
# 根据实际情况替换 {} 中的信息
yr start --master \
--enable_dashboard=true \
--enable_faas_frontend=true \
--enable_collector=true \
--enable_separated_redirect_runtime_std=true \
--prometheus_address={prometheus ip}:{prometheus port} \
--enable_metrics=true \
--metrics_config_file={absolute file path} \
--npu_collection_mode=all \
--port_policy=FIX
您可参考部署参数表按需裁剪不需要的功能。
enable_faas_frontend参数提供查询作业信息功能,影响作业页面内容的显示。enable_collector及enable_separated_redirect_runtime_std参数提供收集函数实例日志功能,影响日志页面内容的显示。prometheus_address、enable_metrics、metrics_config_file和npu_collection_mode参数提供收集指标数据功能,影响 Cluster 页面表格中 CPU、Memory、NPU、Disk 项的显示。开启该功能需部署 Prometheus 服务,请参考部署 Prometheus。port_policy参数用于固定 dashboard 的服务端口。
部署成功将打印 local_ip 和 dashboard_port 信息,如下所示:
Yuanrong deployed succeed
Cluster master info:
    local_ip:x.x.x.x,master_ip:x.x.x.x,etcd_ip:x.x.x.x,etcd_port:32379,global_scheduler_port:22770,ds_master_port:12123,etcd_peer_port:32380,bus-proxy:22772,bus:22773,ds-worker:31501,dashboard_port:9080,
使用 http://local_ip:dashboard_port 作为 dashboard 的访问 URL(默认 URL 为 http://localhost:9080)。
部署从节点无需 enable_dashboard、enable_faas_frontend 和 prometheus_address 参数,其他参数按需配置,参考如下命令:
# 使用前一步骤打印的主节点信息替换引号中的内容,根据实际情况替换 {} 中的信息
yr start --enable_collector=true \
--enable_separated_redirect_runtime_std=true \
--enable_metrics=true \
--metrics_config_file={absolute file path} \
--npu_collection_mode=all \
--master_info "local_ip:x.x.x.x,master_ip:x.x.x.x,etcd_ip:x.x.x.x,etcd_port:32379,global_scheduler_port:22770,ds_master_port:12123,etcd_peer_port:32380,bus-proxy:22772,bus:22773,ds-worker:31501,dashbaord_port:9080,"
页面介绍#
dashboard 有多个页面,根据功能查看对应页面:
查看总逻辑资源占用率:Overview 页面,Cluster 页面
概览所有组件和实例状态:Overview 页面
查看所有节点和组件的状态和逻辑资源占用率:Cluster 页面
查看所有作业的进度和状态:Jobs 页面
查看所有实例的任务进度和状态:Instances 页面
查看和下载实例的日志和错误信息:Logs 页面
Overview 页面#
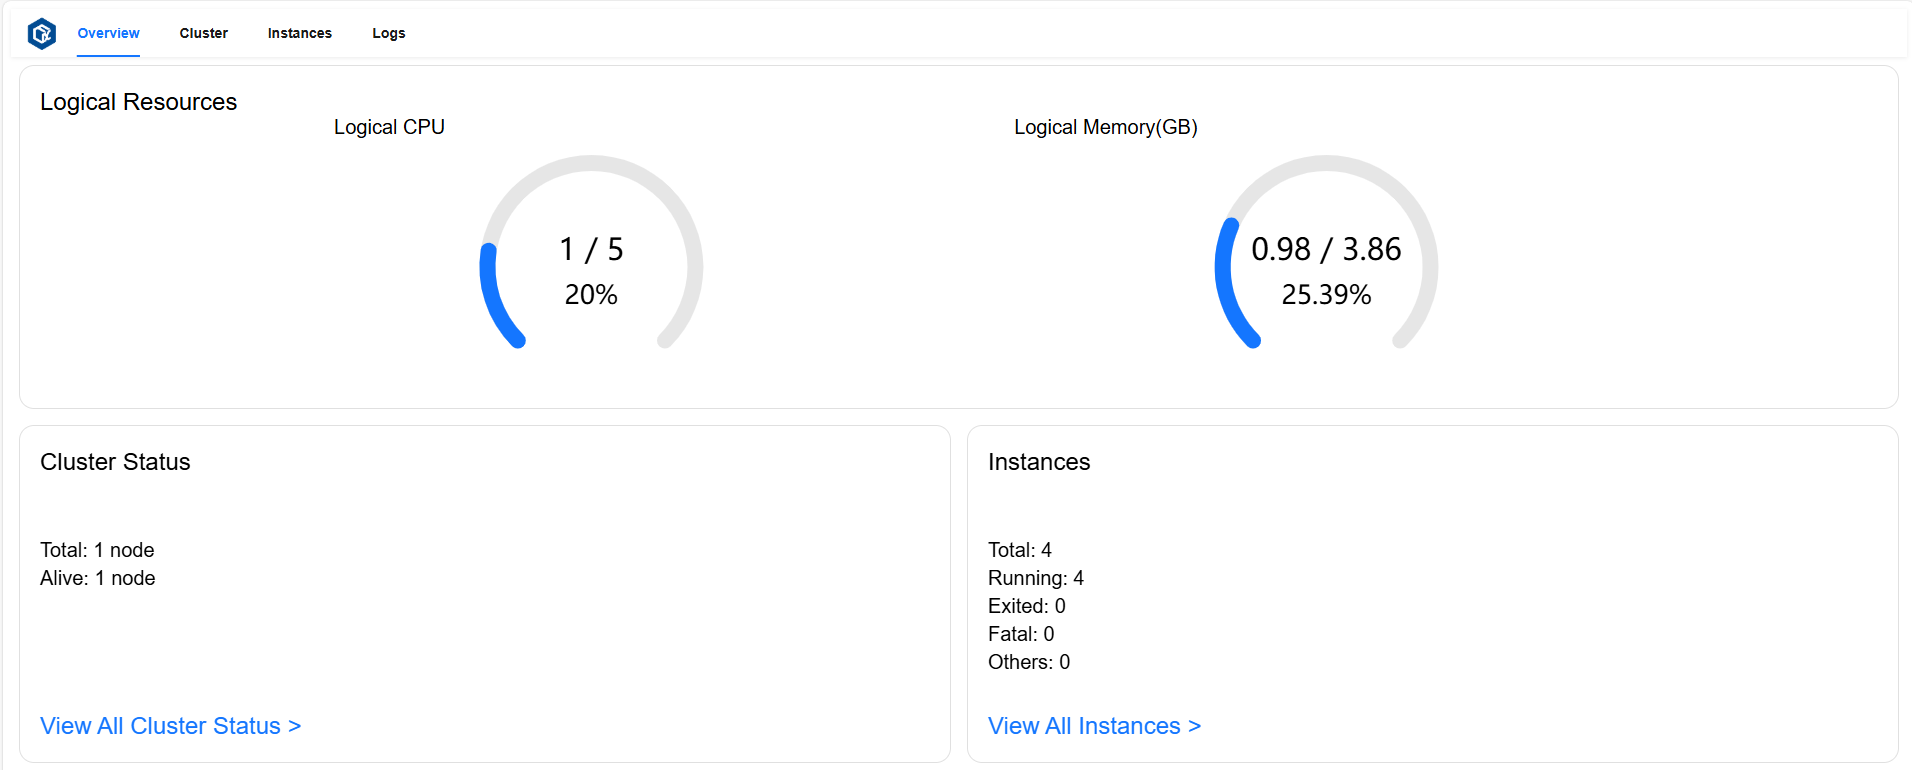
Overview 页面可以查看总逻辑资源占用率、概览所有组件和实例状态。
逻辑资源卡(Logical Resources)展示了 Logical CPU 总占用核数、总核数及总占用率,Logical Memory 总占用量(GB)、总内存量(GB)及总占用率。
集群状态卡片(Cluster Status)展示了总节点数和活跃节点数。
实例状态卡片(Instances)展示了总实例数和
running、exited、fatal状态实例数。
页面示例:
Cluster 页面#
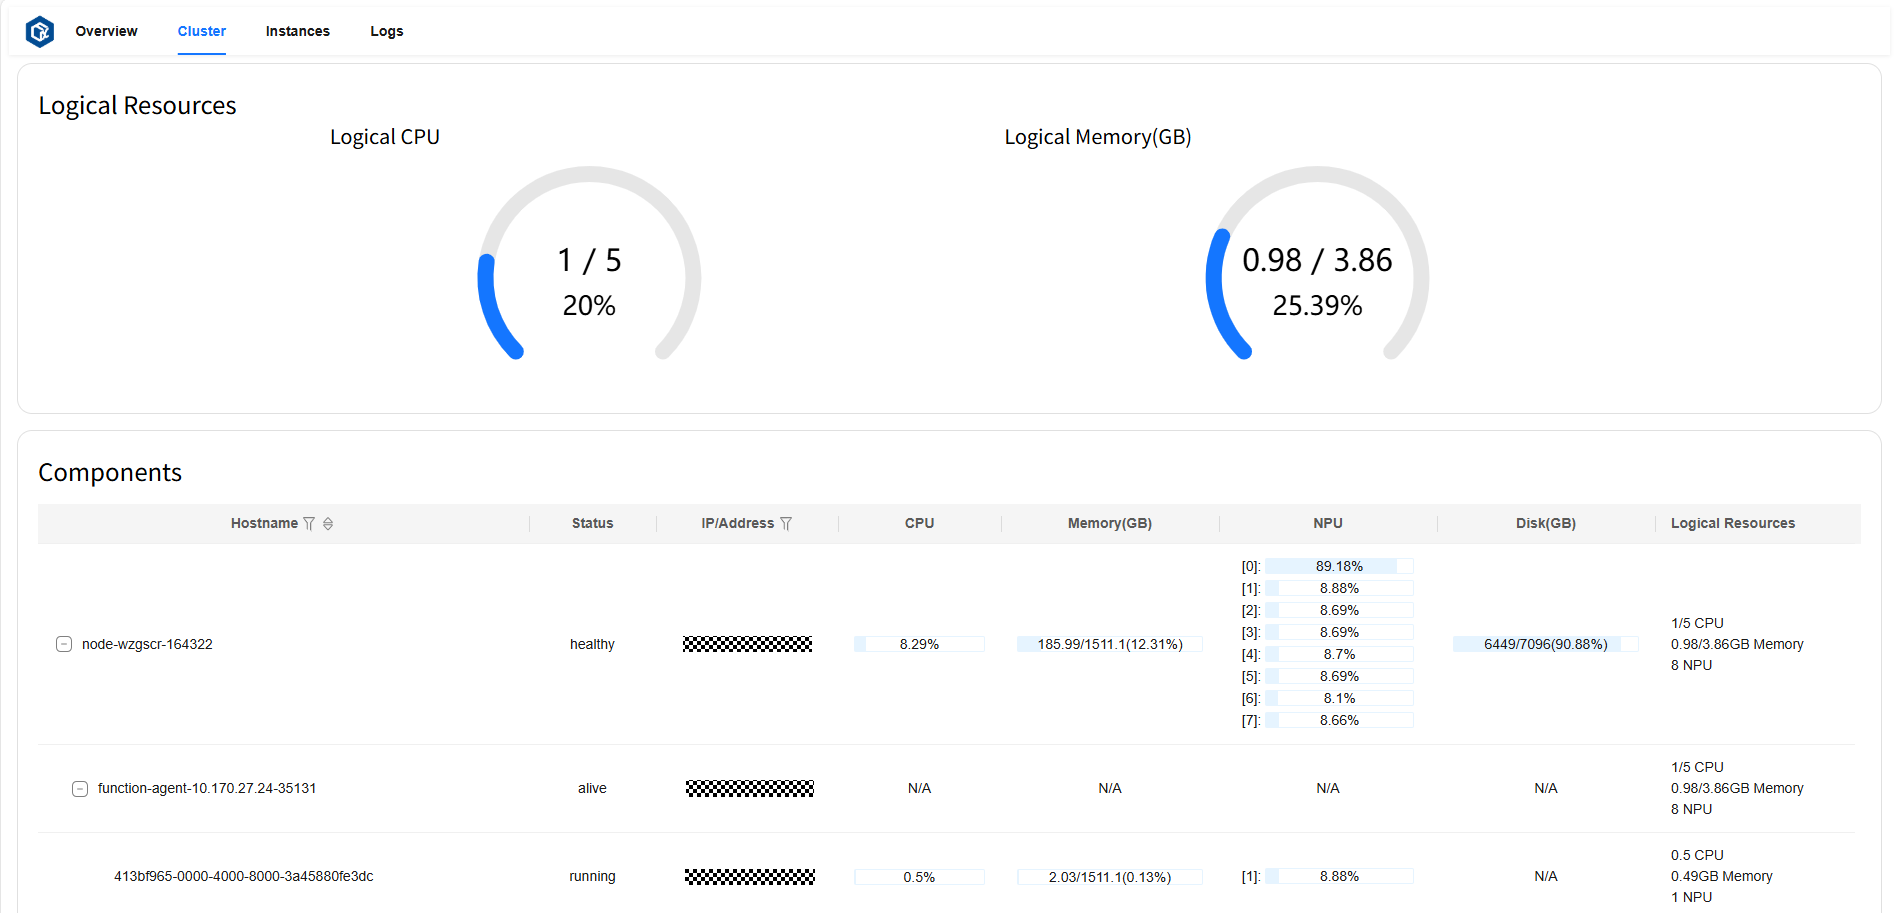
Cluster 页面可以查看总逻辑资源占用率,所有节点和组件的状态及各资源指标使用情况,并将节点和组件的层次关系可视化。
逻辑资源卡片(Logical Resources)展示了 Logical CPU 总占用核数、总核数及总占用率,Logical Memory 总占用量(GB)、总内存量(GB)及总占用率。
组件卡片(Components)展示了节点(node)的状态、地址、CPU 和 NPU 占用率、Memory/Disk/Logical Resources 各指标的使用量、总量及占用率;运行在对应节点上的代理(agent)的状态、地址、Logical Resources 指标的使用量、总量及占用率;运行在对应代理上的实例(instance)的状态、地址、CPU 和 NPU 占用率、Memory/Logical Resources 各指标的使用量、总量及占用率。
页面示例:
Jobs 页面#
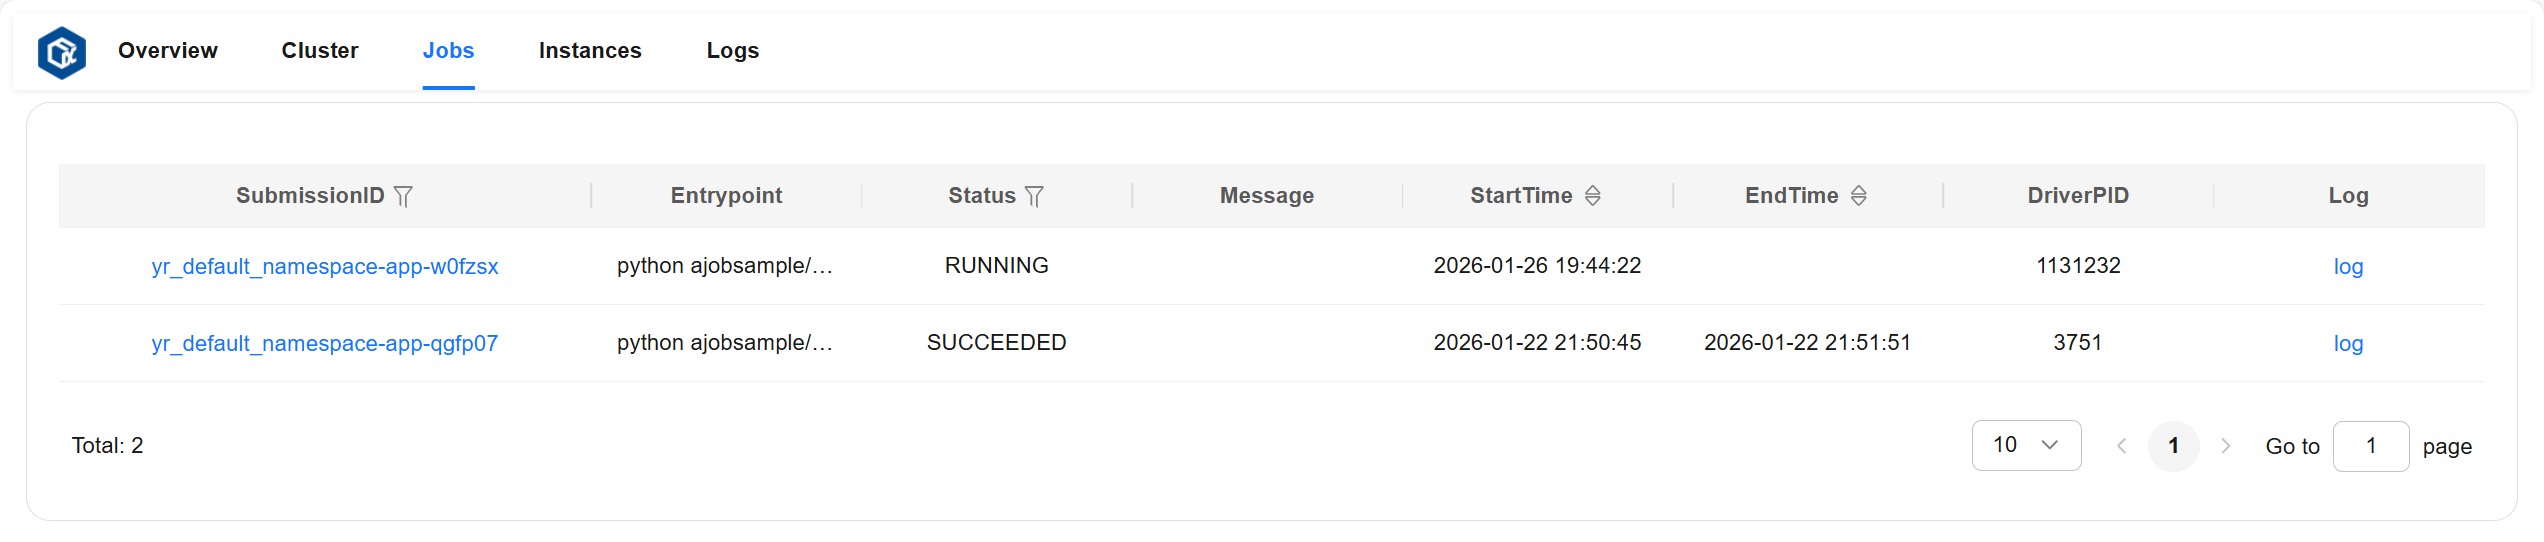
Jobs 页面可以查看所有作业的详细信息。
作业详细信息说明:
entrypoint:作业的入口命令。
runtimeEnv:作业的运行时环境。
submissionID:提交作业时的提交 id。
status:作业状态(包括:“PENDING”、“RUNNING”、“STOPPED”、“SUCCEEDED”、“FAILED”)。
startTime:作业的启动时间。
endTime:作业的结束时间。
message:描述作业状态的详细信息。
driverNodeID:作业运行节点的 id。
driverNodeIP:作业运行节点的 ip。
driverPID:作业运行进程的 pid。
页面示例:
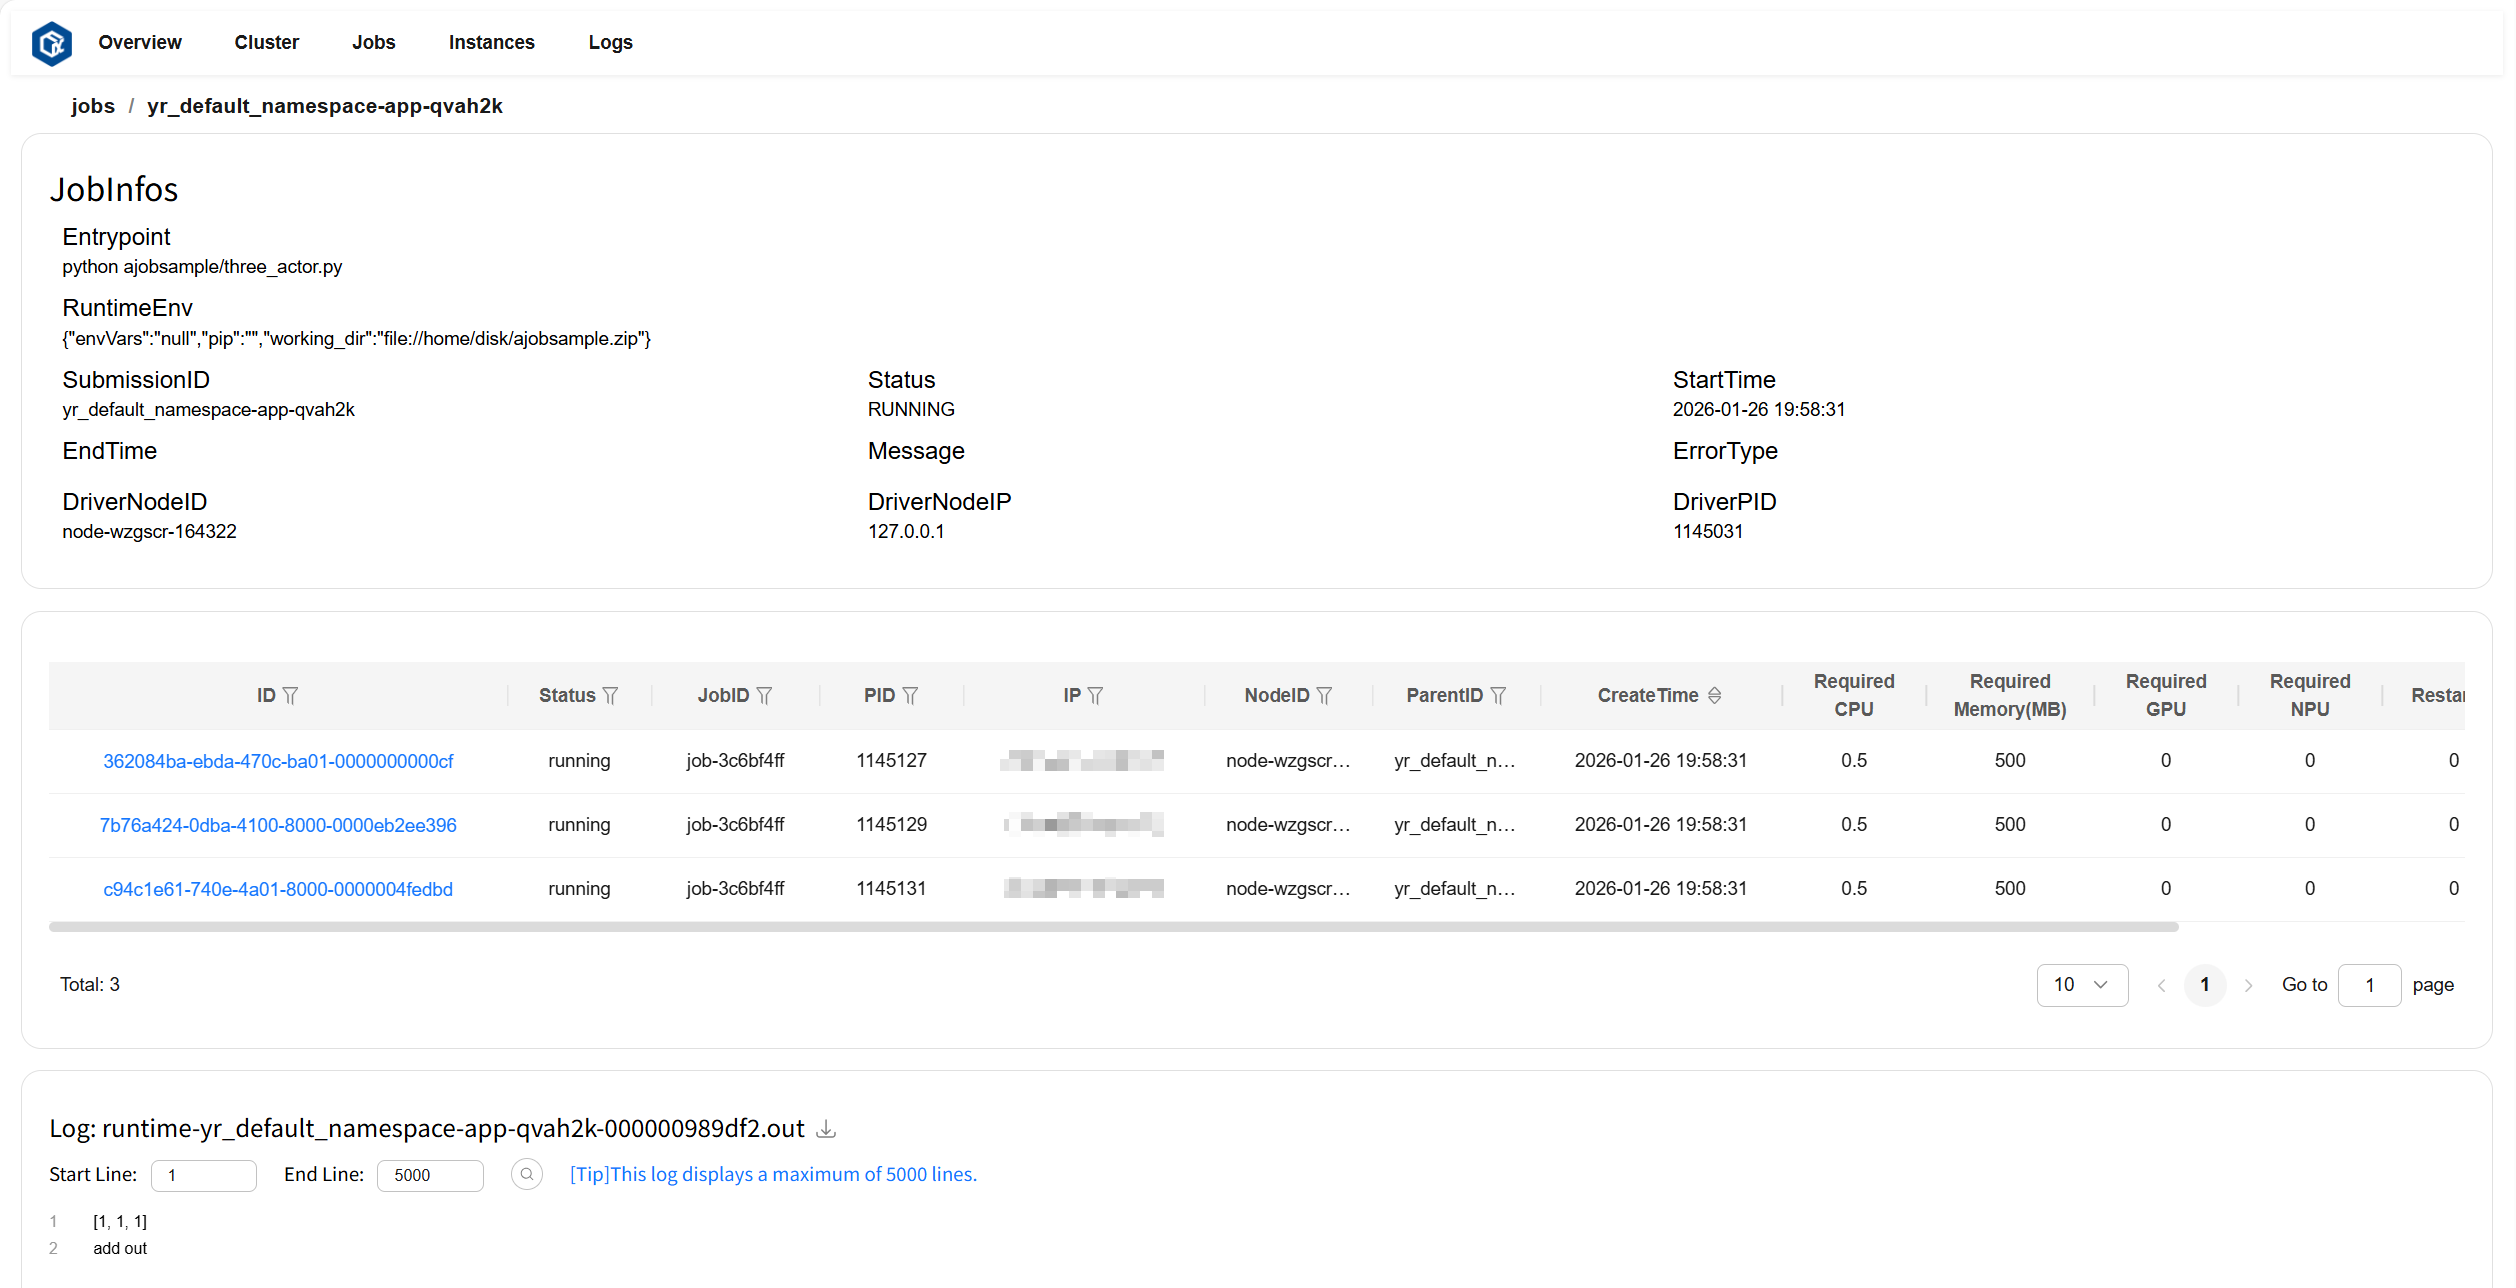
点击 SubmissionID 或 log 跳转至此作业的详情页。其中作业详情卡片(JobInfos)展示了此作业的详细信息,实例列表卡片展示了此作业包含的实例信息,日志卡片(Log)显示此作业的日志和错误信息。
页面示例:
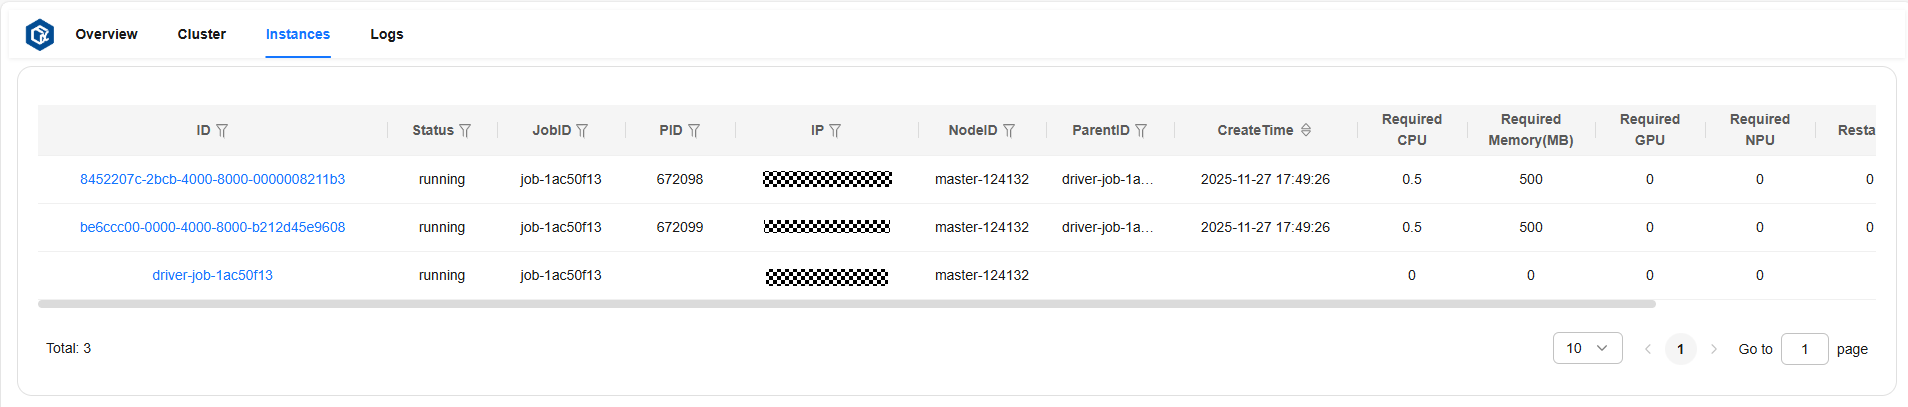
Instances 页面#
Instances 页面可以查看所有实例的详细信息。
实例详细信息说明:
ID:实例 id。
status:实例状态。
jobID:实例对应作业的 id。
PID:运行实例进程的 pid。
IP:运行节点的 ip。
nodeID:运行节点的 id。
parentID:父实例的 id。
createTime:实例的创建时间。
required CPU:实例需要的 CPU 核数。
required Memory:实例需要的内存量,单位为 MB。
required GPU:实例需要的 GPU 核数。
required NPU:实例需要的 NPU 核数。
restarted:实例重启次数。
exitDetail:实例退出时的详细信息。
页面示例:
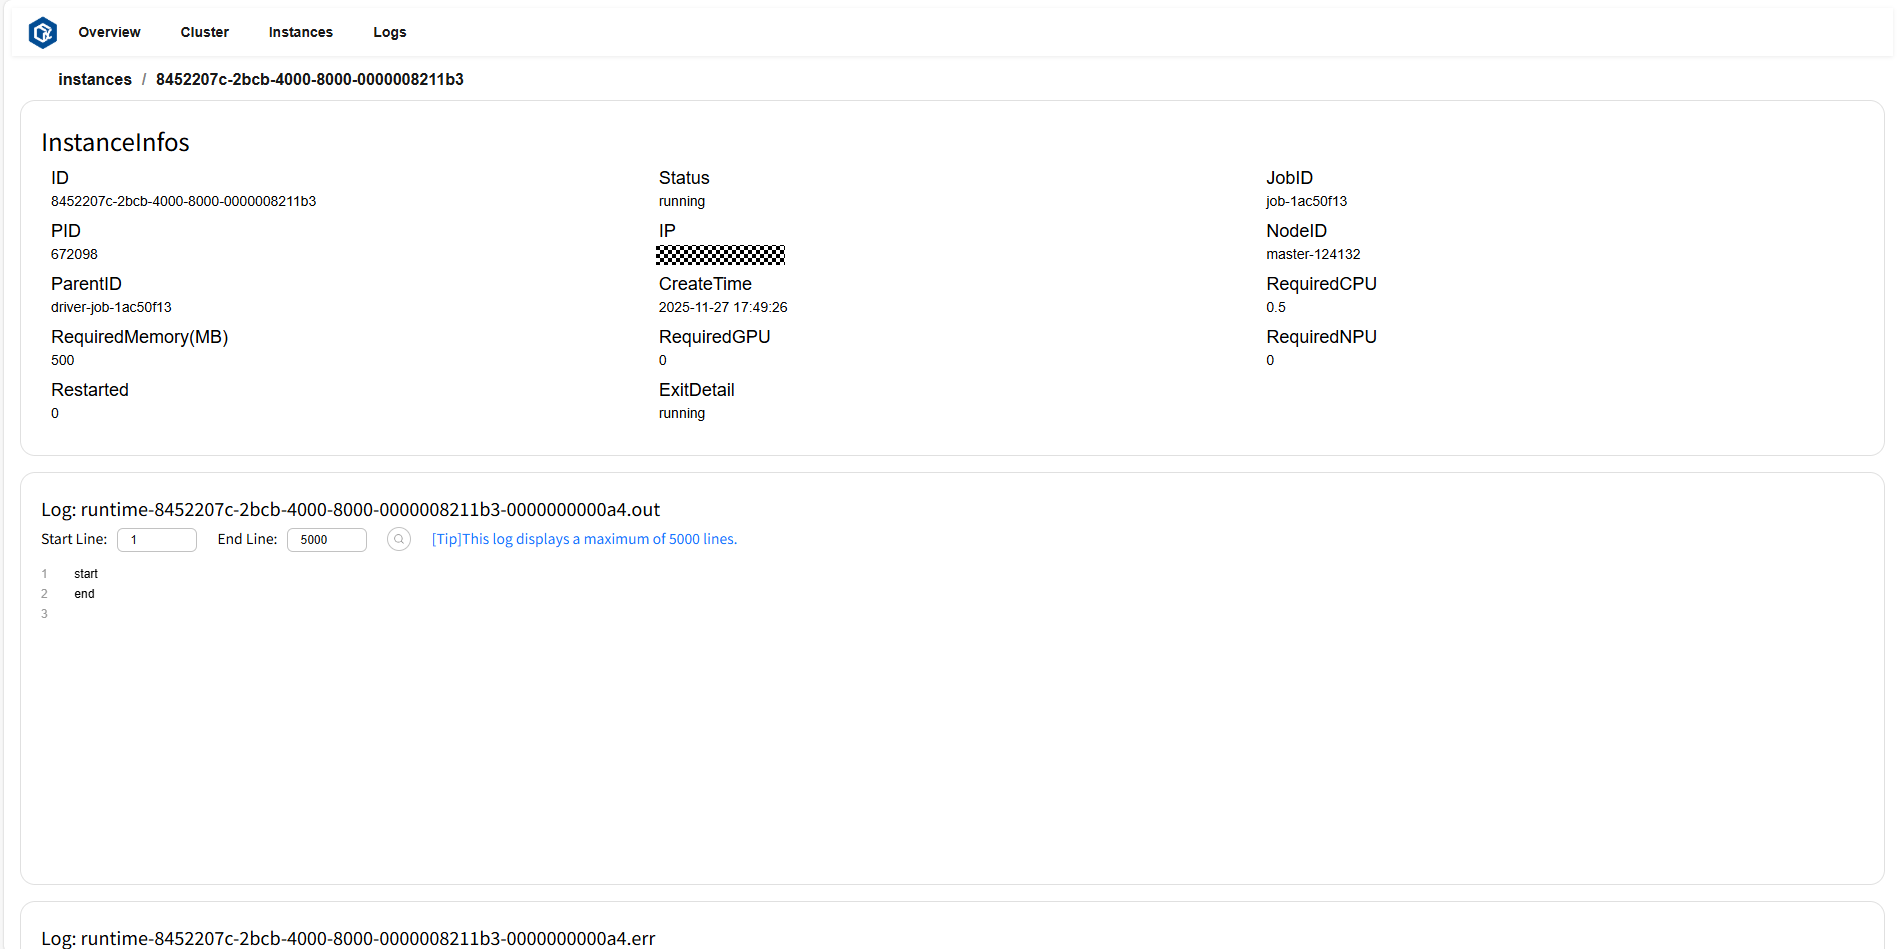
点击 ID 或 log 跳转至实例详情页。其中实例详情卡片(InstanceInfos)展示了此实例的详细信息,日志卡片(Log)显示此实例的日志和错误信息。
页面示例:
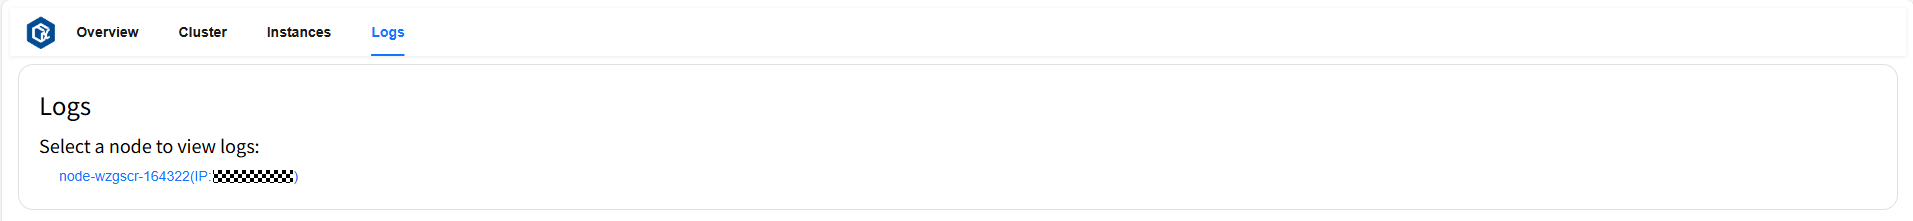
Logs 页面#
Logs 页面可以查看和下载所有日志内容和错误信息。页面示例:
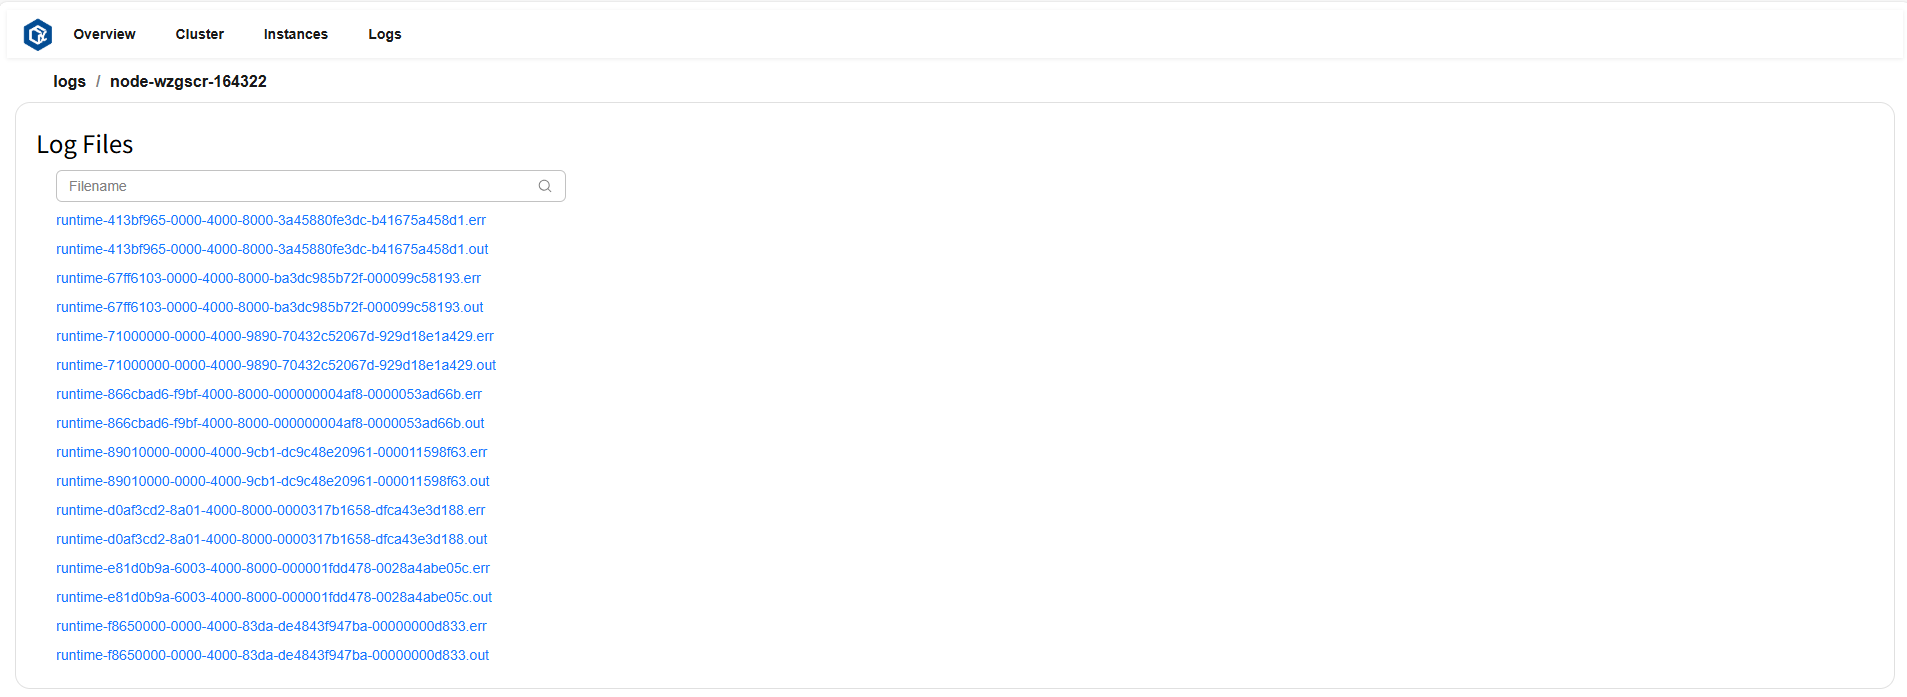
点击选中的节点,可查看该节点下所有日志文件列表。页面示例:
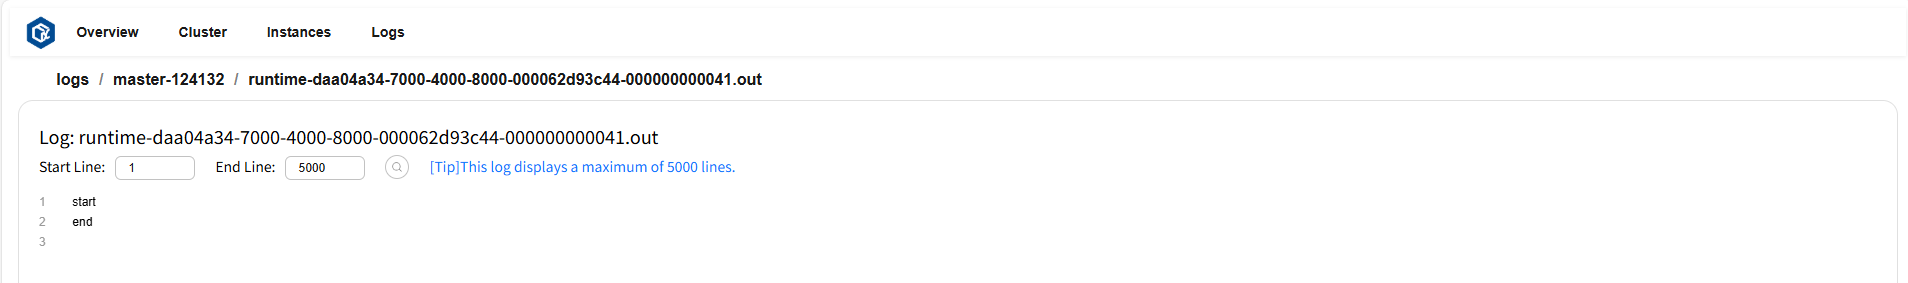
点击想要查看的文件,即可展示文件内容。页面示例:
部署 Prometheus#
openYuanrong 通过 Pushgateway 推送数据到 Prometheus,首先需部署 Pushgateway。下载 Pushgateway 并参考如下命令完成部署。
tar -xzvf pushgateway-x.xx.x.linux-amd64.tar.gz # tar 包名替换为您下载的文件名
cd pushgateway-x.xx.x.linux-amd64
nohup ./pushgateway > ./pushgateway.log 2>&1 & # pushgateway 默认端口为 9091
配置 Prometheus#
下载 Prometheus 并解压。
tar -xzvf prometheus-x.x.x.linux-amd64.tar.gz # tar 包名替换为您下载的文件名
cd prometheus-x.x.x.linux-amd64
修改 prometheus.yml 文件,在 scrape_configs 配置项中新增如下内容,其中 127.0.0.1 替换为运行 Pushgateway 的机器 IP。
- job_name: 'pushgateway'
  static_configs:
    - targets: ['127.0.0.1:9091']
启动 Prometheus#
nohup ./prometheus > ./prometheus.log 2>&1 & # prometheus 默认端口为 9090